> For the complete documentation index, see [llms.txt](https://mey.istad.co/llms.txt). Markdown versions of documentation pages are available by appending `.md` to page URLs; this page is available as [Markdown](https://mey.istad.co/statistical-techniques-in-business-and-economics/chapter-1-what-is-statistics.md).
# Chapter 1: What is Statistics?
## Why study Statistics?
If you look through your university catalog, you will find that statistics is required for many college programs. **Why is this so?**
What are the **differences** in the statistics courses taught in the Engineering College, the Psychology or Sociology Departments in the Liberal Arts College, and the College of Business?
> The biggest difference is the examples used.
The course content is basically the same. Their interest in different fields such as:
| College of Business | Psychologists | Engineers |
| ------------------------------------------------ | ------------------------- | ------------------------------------------------------------------- |
| Interested in profits, hours of worked and wages | Interested in test scores | Interested in how many units are manufactured on particular machine |
However, all three are interested in what is a typical value and how much variation there is in the **data**. There may also be a difference in the level of **mathematics** required.
An engineering statistics course usually requires ***calculus***. Statistics courses in colleges of business and education usually teach the course at a more applied level. You should be able to handle the **mathematics** in this text if you have completed high school **algebra**.
`So why is statistics required in so many majors?`
1. `The first reason is that numerical information is everywhere`
Data is defined as “information, especially facts or numbers, collected to be examined, considered and used to help decision-making”. We’re unconsciously using [data ](https://becominghuman.ai/generalization-technique-for-ml-models-ed6ba666d171)all the time — you’re consuming this piece of data right now.
Social Media Active User Data
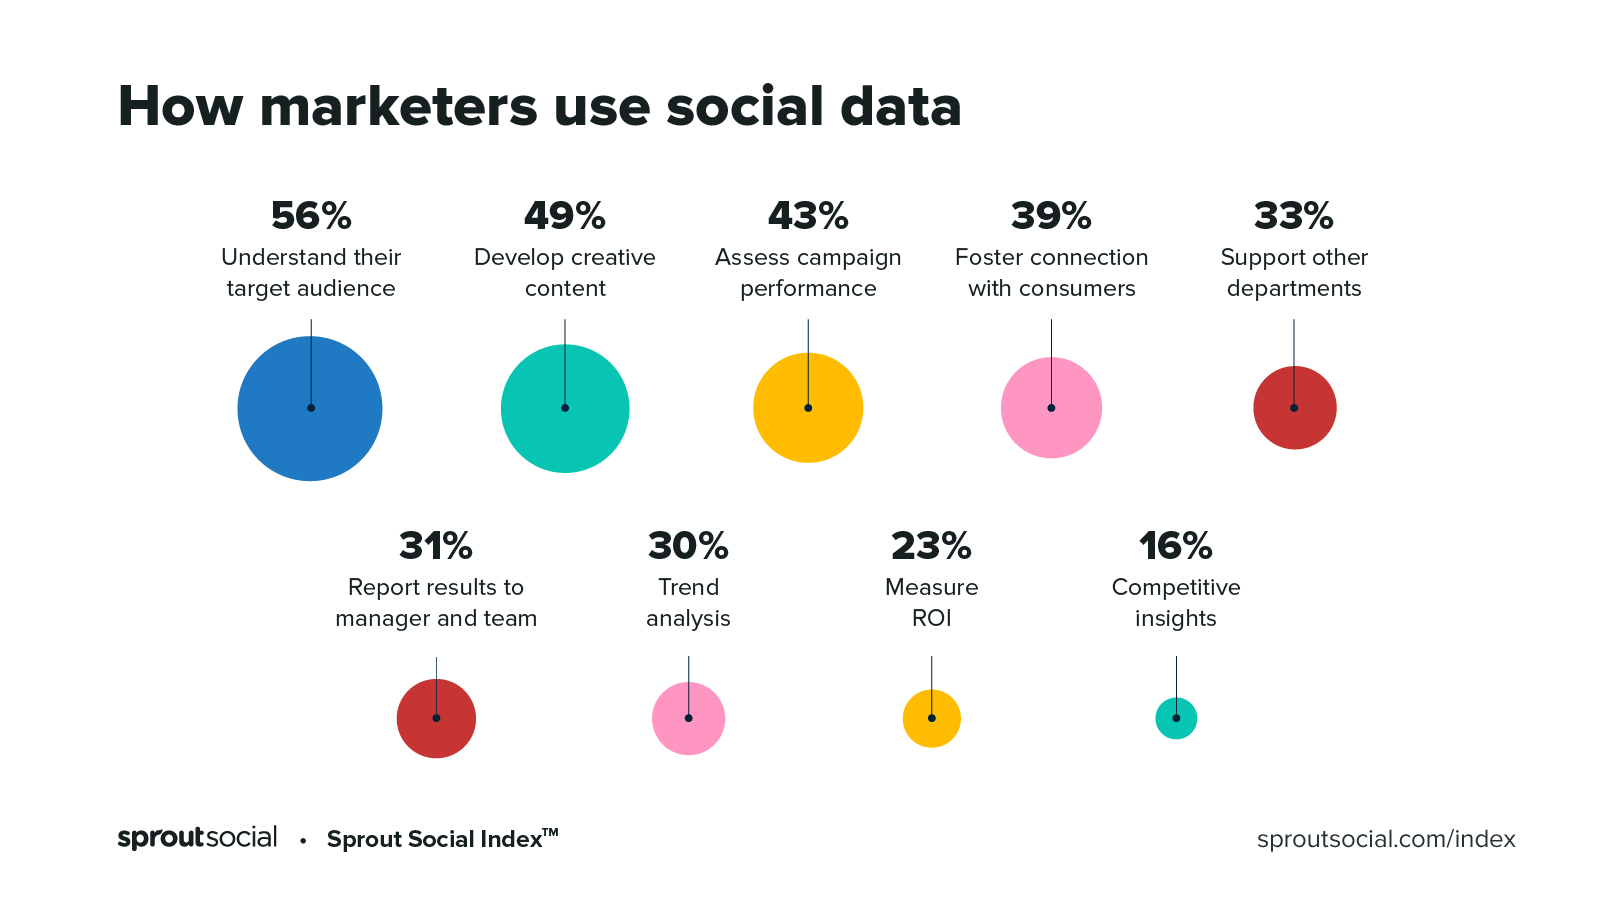
How marketer use data?
2. `A second reason for taking a statistics course is that statistical techniques are used to make decisions that affect our daily lives. That is, they affect our personal welfare. Here are a few examples:`
* Insurance companies use statistical analysis to set rates for home, automobile, life, and health insurance. Tables are available showing estimates that a 20-year- old female has 60.25 years of life remaining, an 87-year-old woman 4.56 years remaining, and a 50-year-old man 27.85 years remaining. Life insurance premiums are established based on these estimates of life expectancy.
* Medical researchers study the cure rates for diseases using different drugs and different forms of treatment. For example, what is the effect of treating a cer- tain type of knee injury surgically or with physical therapy? If you take an aspirin each day, does that reduce your risk of a heart attack?
3. `A third reason for taking a statistics course is that the knowledge of statistical methods will help you understand how decisions are made and give you a better understanding of how they affect you.`
No matter what line of work you select, you will find yourself faced with deci- sions where an understanding of data analysis is helpful. In order to make an informed decision, you will need to be able to:
* Determine whether the existing information is adequate or additional information is required.
* Gather additional information, if it is needed, in such a way that it does not pro- vide misleading results.
* Summarize the information in a useful and informative manner.
* Analyze the available information.
* Draw conclusions and make inferences while assessing the risk of an incorrect
conclusion.
*The statistical methods presented in the text will provide you with a framework* for the decision-making process.
In summary, there are at least three reasons for studying statistics: (1) data are everywhere, (2) statistical techniques are used to make many decisions that affect our lives, and (3) no matter what your career, you will make professional decisions that involve data. An understanding of statistical methods will help you make these decisions more effectively.